
Although the data distinguish between economic branches according to standard ILO (International Labor Office) definitions, they do not distinguish between occupations and employers. Hence, it is difficult to analyse labor market mobility unless employees happened to move between economic branches. Here we present data on the distribution of employment between economic branches as well as data on mobility between economic branches. These data testify to a high degree of mobility between economic branches. They also show that members of the study group worked in all branches of the economy. These data understate true mobility because study group members who switched employers in the same economic branch go unrecorded.
The economic branches in which the employed worked, which are many and varied. Figure SM1 shows the economic branches in which the study group worked during 2003 - 2012. In 2012 the largest economic branches were accommodation, food services and entertainment, and other services. The importance of these branches varied over time. More generally, study group members were represented in all major economic branches.
Figure SM1 Distribution of Employment by Economic Branch
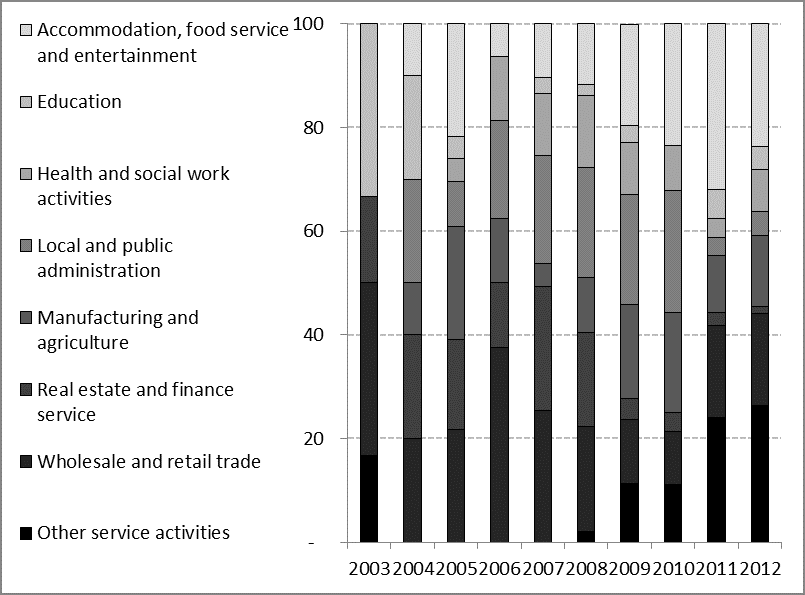
Bars show the sectoral distribution of employment for study group members by year.
Just as earnings are upwardly mobile, so is there a high degree of mobility in the economic branches chosen by the study group. Table SM1 shows that out of the 99 members of the study group who were employed two years, almost a half worked in two different economic branches. Out of the 71 members employed three years, 60.6% worked in two different economic branches and almost 20% worked in three economic branches. Table SM1 understates the degree of mobility in employment because, the data do not refer to work establishments. For example, workers who switched employer within the same economic branch are not counted in Table SM1. Nor are workers employed in more than one economic branch within calendar years. In summary, Figure SM1 and Table SM1 point to a high degree of labor market mobility among members of the study group.
Table SM1 Employment Mobility between Economic Branches
(percent)
Years employed | Persons | Number of Economic Branches | ||||
2 | 3 | 4 | 5 | 6 | ||
2 | 99 | 49.5 |
|
|
|
|
3 | 71 | 60.6 | 19.7 |
|
|
|
4 | 40 | 32.5 | 27.5 | 17.5 |
|
|
5 | 31 | 19.4 | 32.2 | 38.7 | 6.5 |
|
6 -10 | 27 | 18.5 | 33.3 | 33.3 | 14.8 |
|
The table reports the number of economic branches in which study group members worked by the number of years that they were employed.